Farmbox helps farmers track operations, monitor crops, and reduce pesticide use. The platform covers over 4 million hectares of Brazilian farmland.
Farmbox helps farmers track operations, monitor crops, and reduce pesticide use. The platform covers over 4 million hectares of Brazilian farmland.
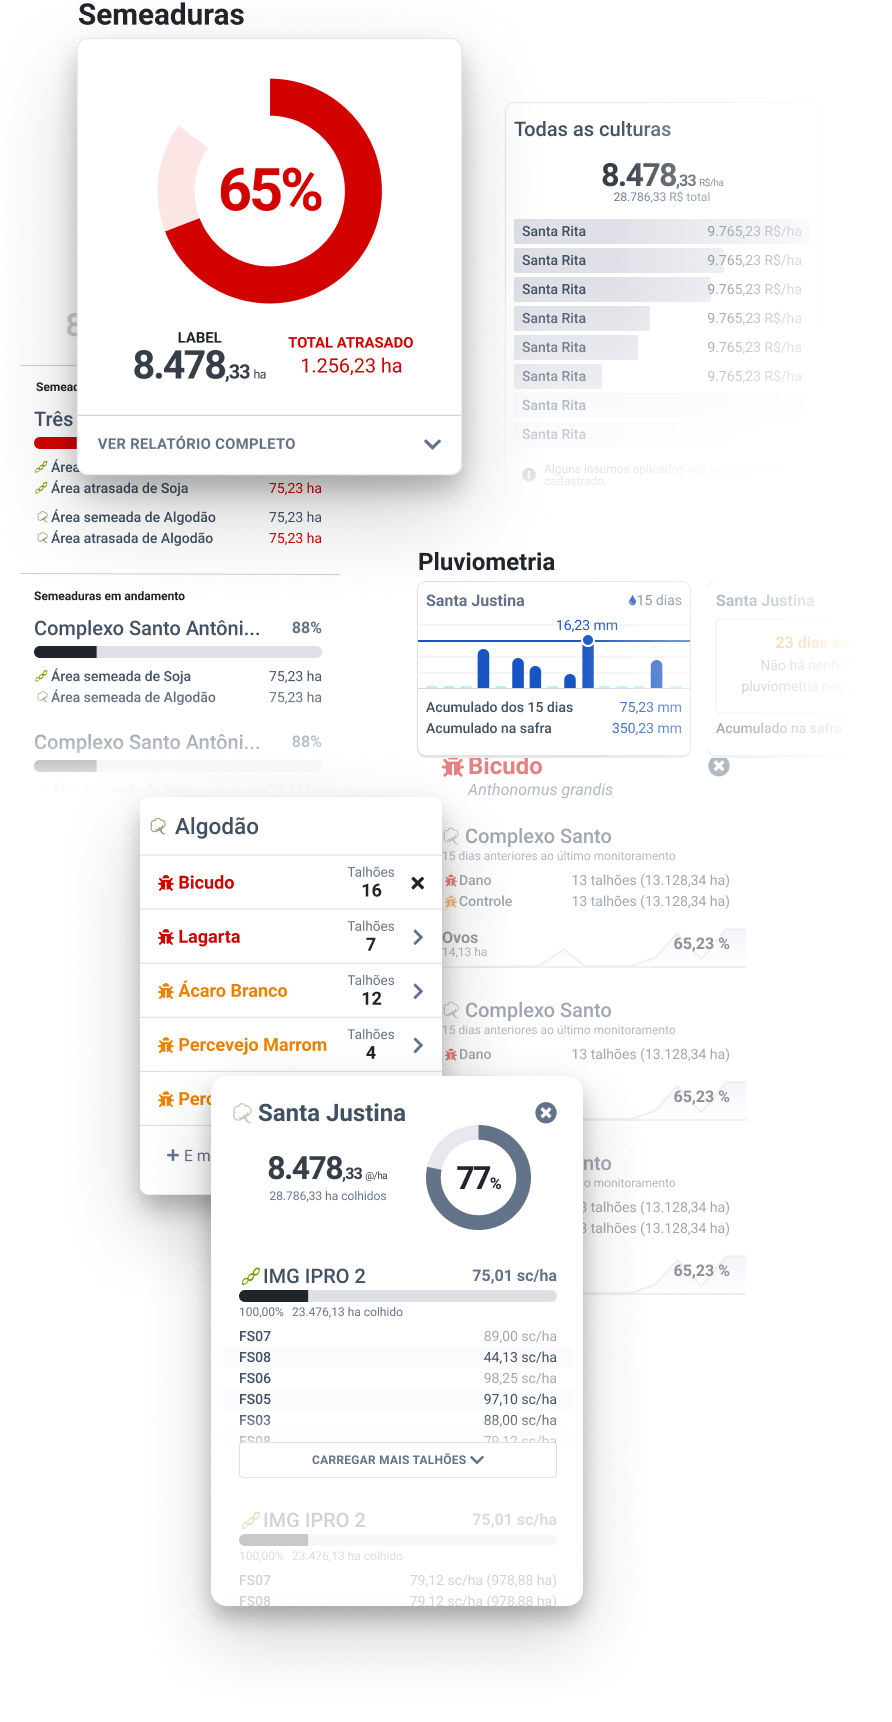
Farms run dozens of operations daily. Spraying, scouting, harvesting, all happening across hundreds of fields. Tracking this data is how farmers make better decisions next season.
When logging data also helps you do your job by showing relevant insights and surfacing warnings, people actually use the app. We designed for engagement, not just compliance.
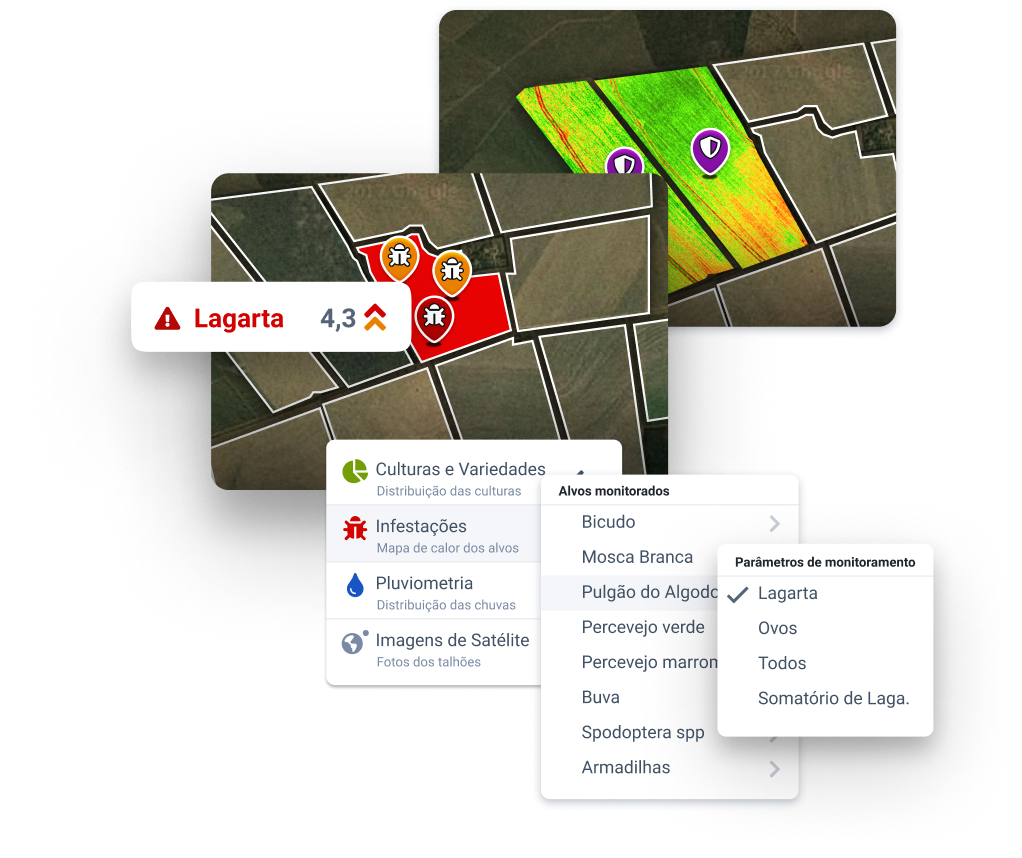
Farmbox shows alerts when something needs attention. Too many warnings cause blindness. We designed a hierarchy: critical alerts interrupt, minor ones inform, informational ones wait until you ask.
The map is the interface. Every finding, photo, and data point has a location. We made geography the primary navigation.
Farmbox is independent from pesticide companies. Our job is to help farmers spray less, not more.
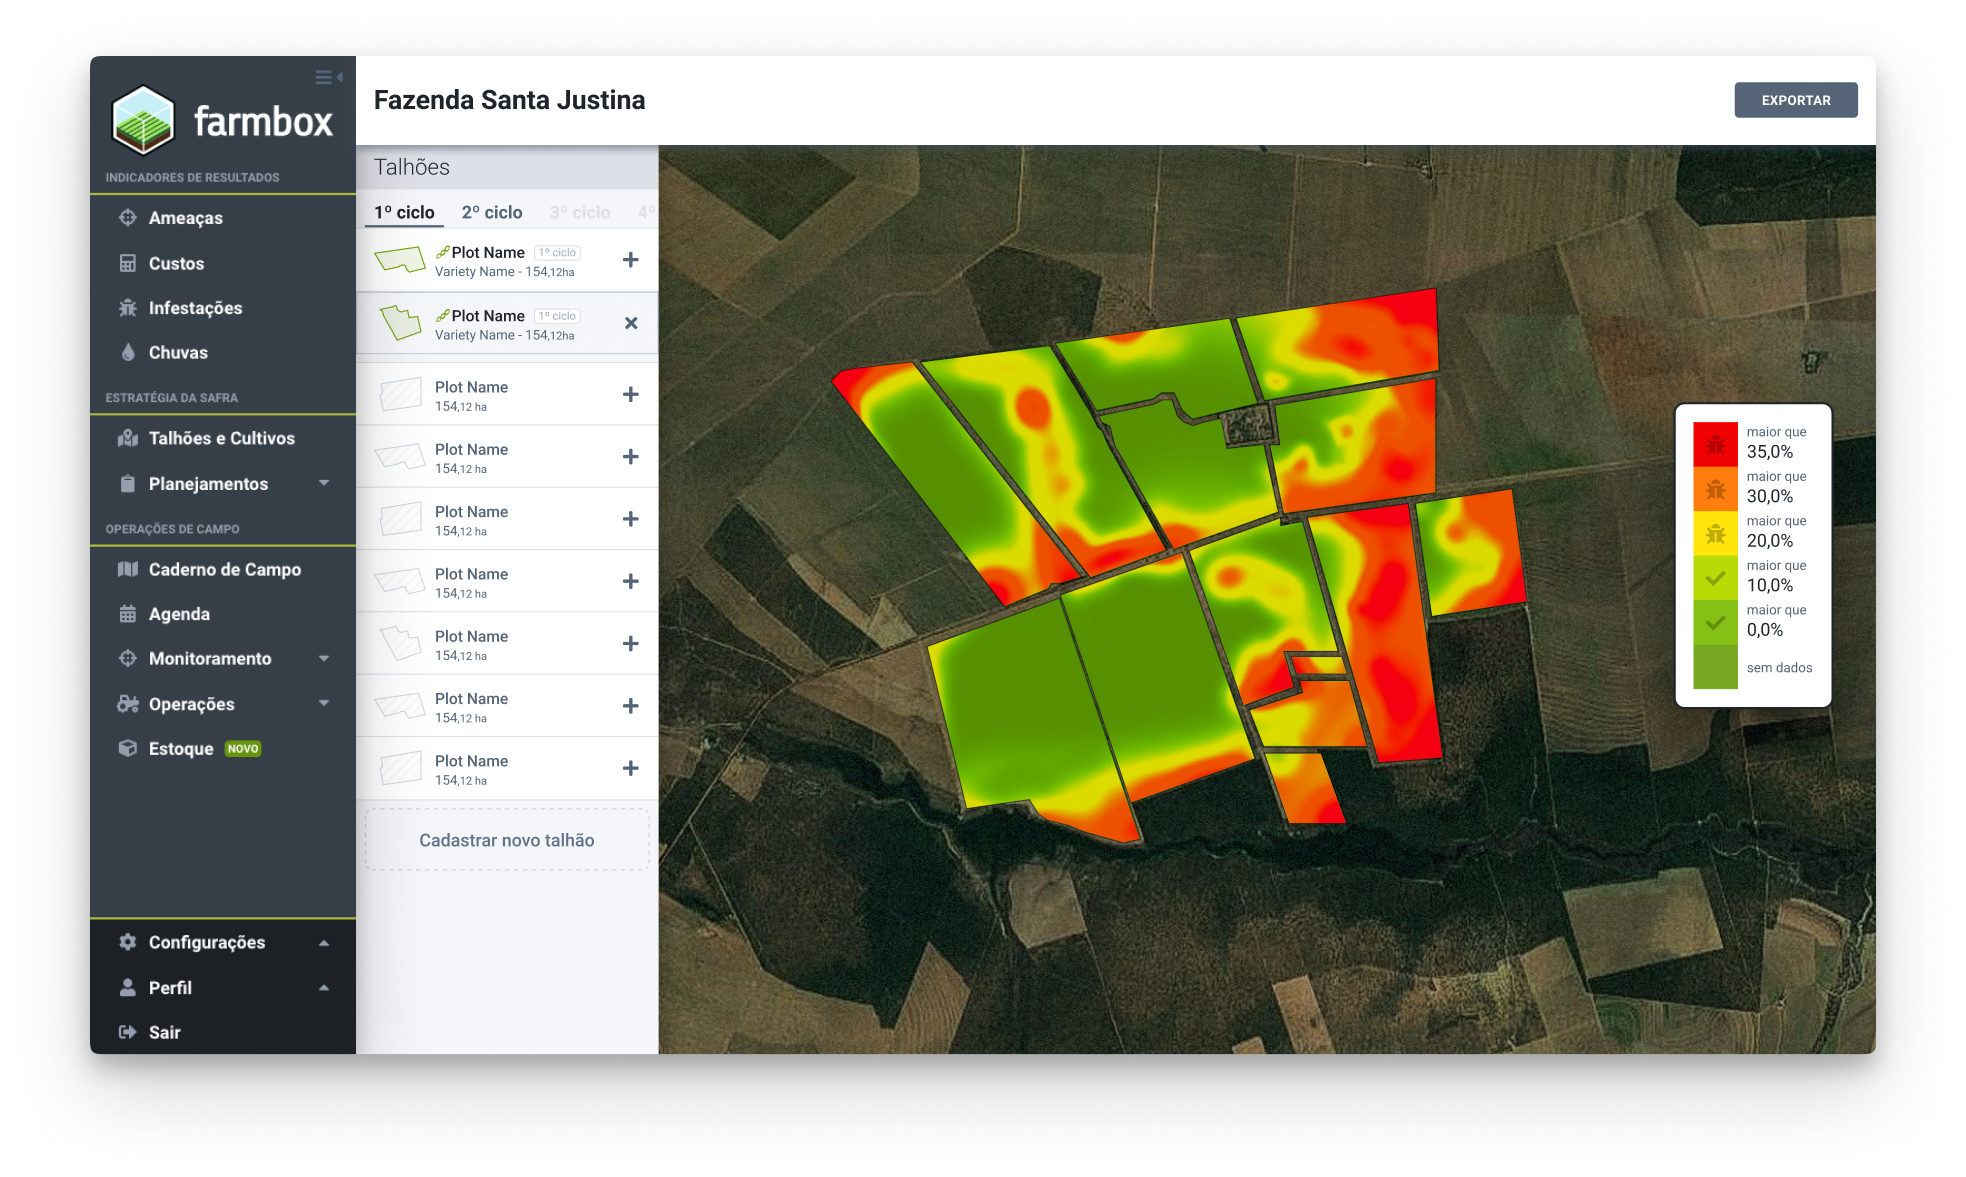
The rasterbox engine generates custom heatmaps showing exactly where treatment is needed. Farmers target problem areas instead of blanket-spraying entire fields.
Every avoided application matters.
Combination of Google Maps, HighCharts → and custom visualizations.
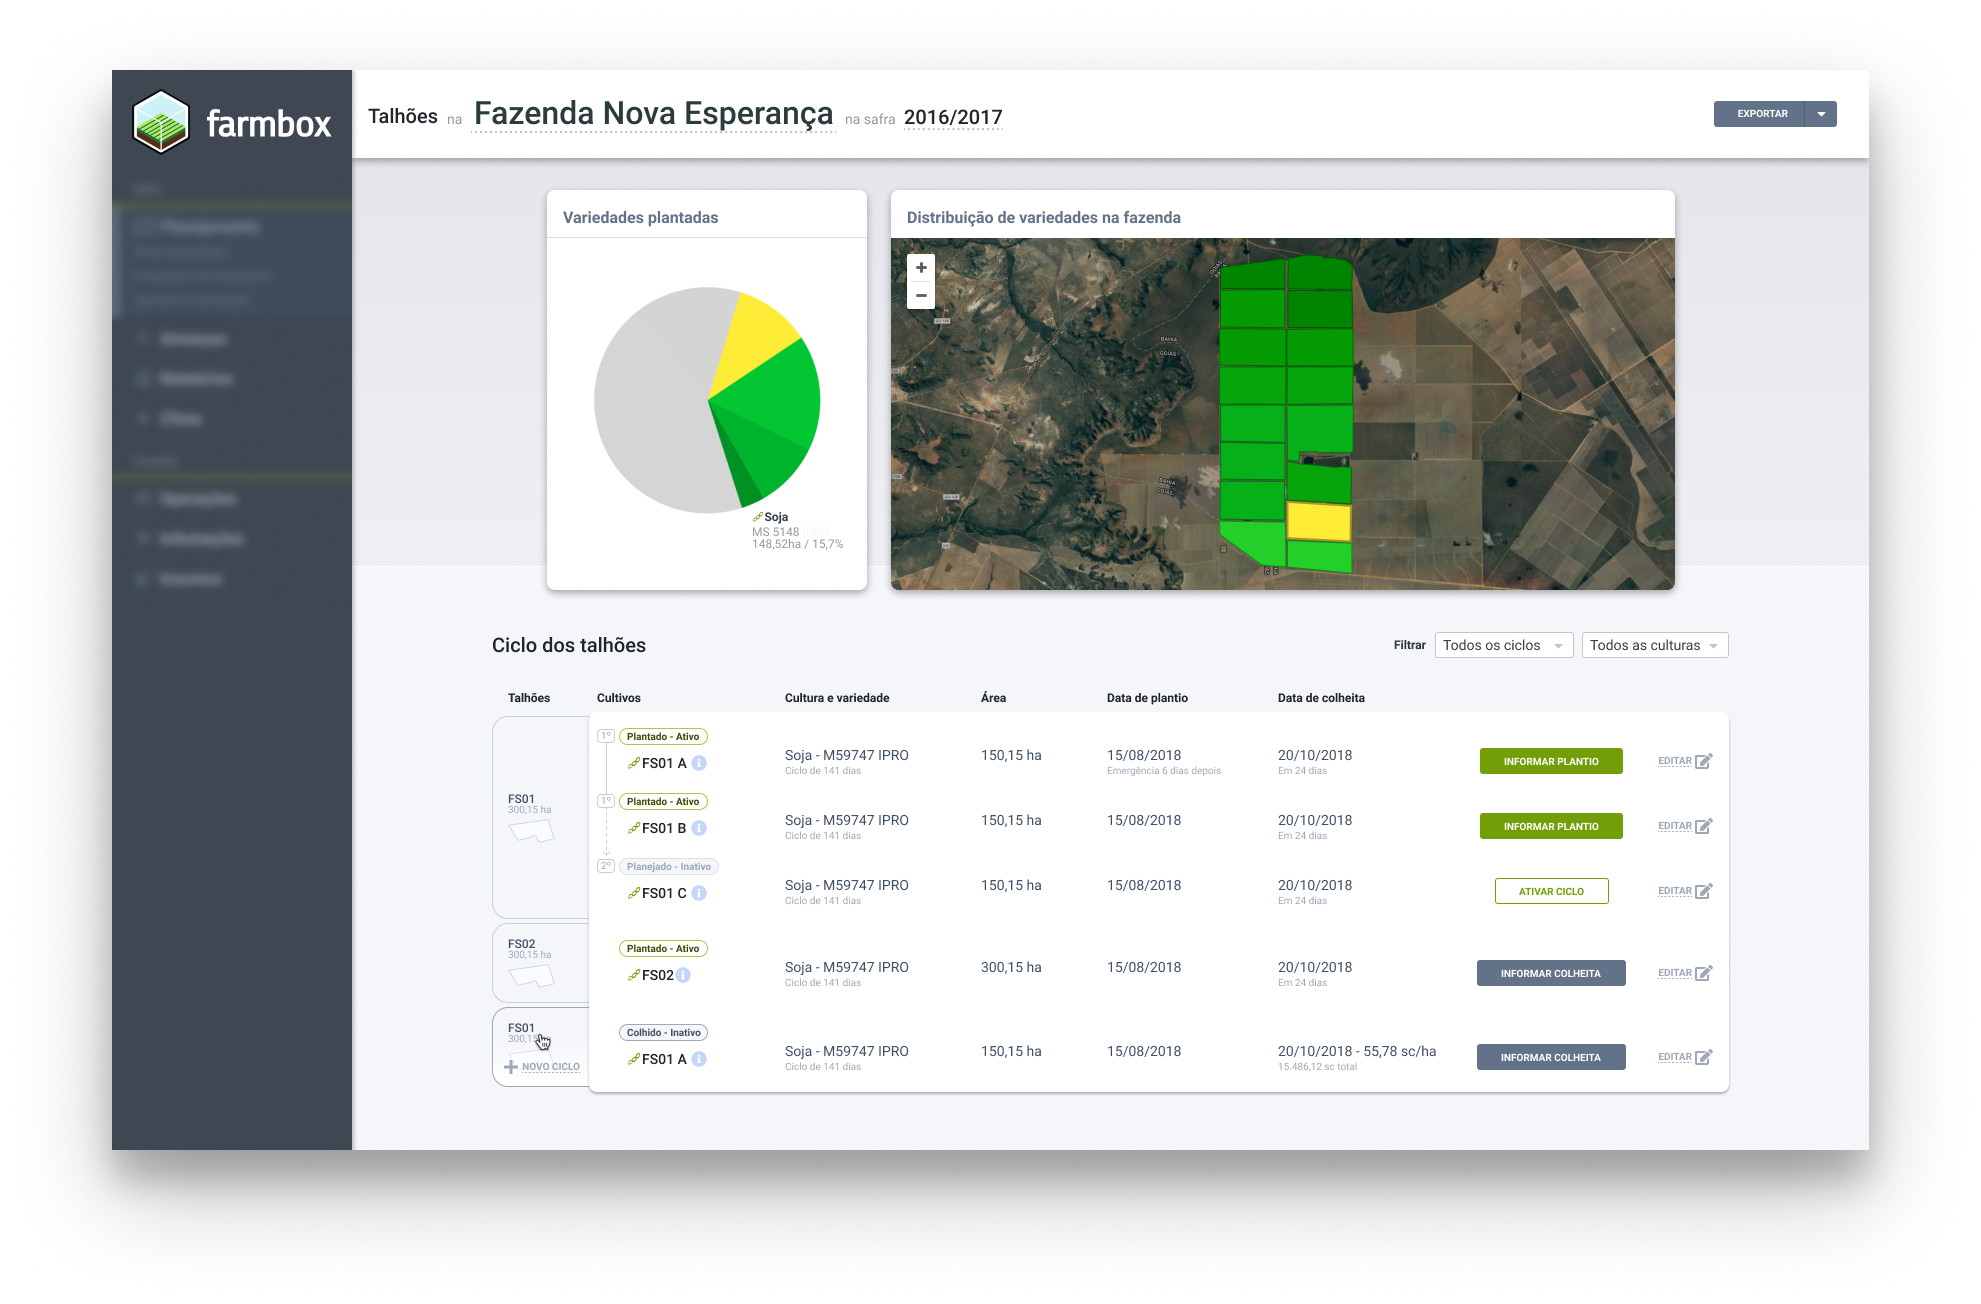
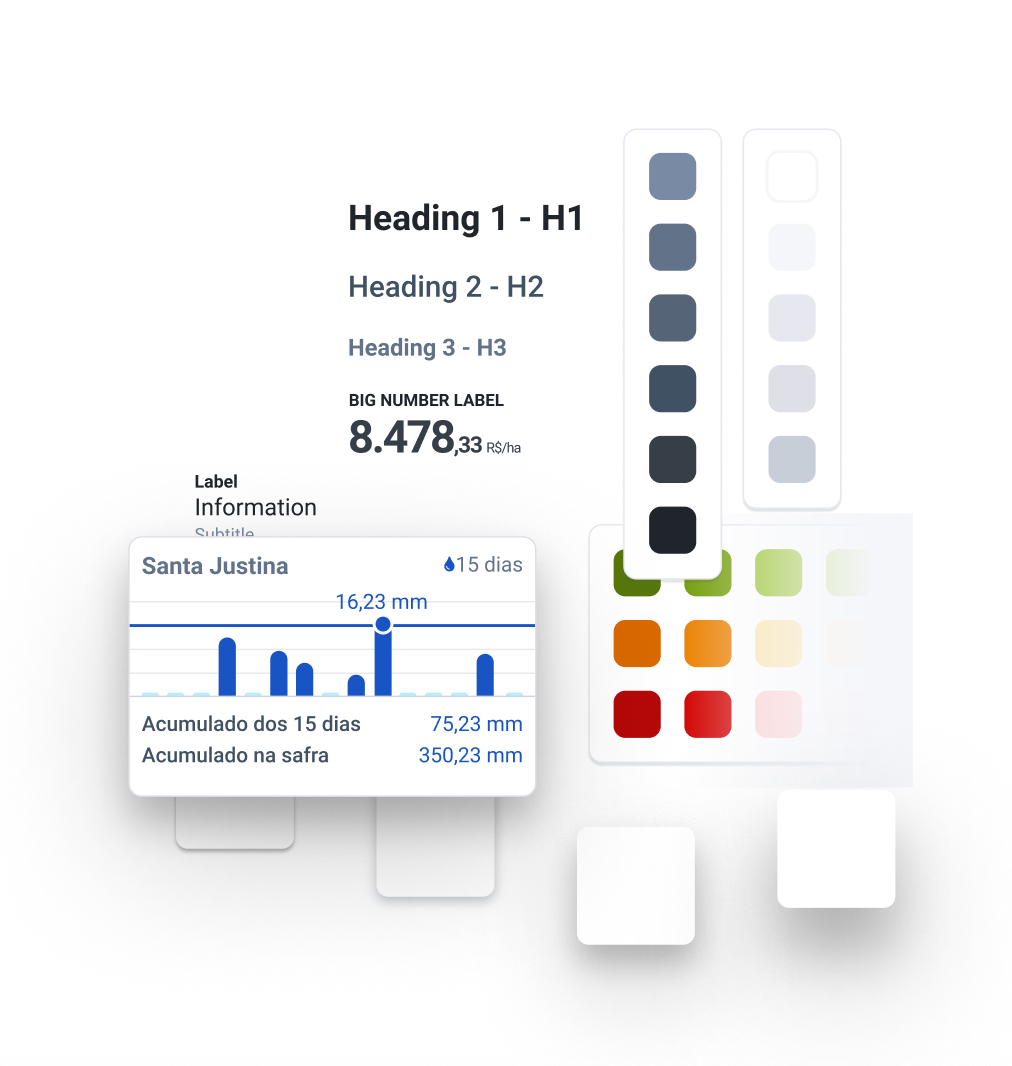
Different dashboards share the same charts, but you you’ll never need to read a label to remember what it is.
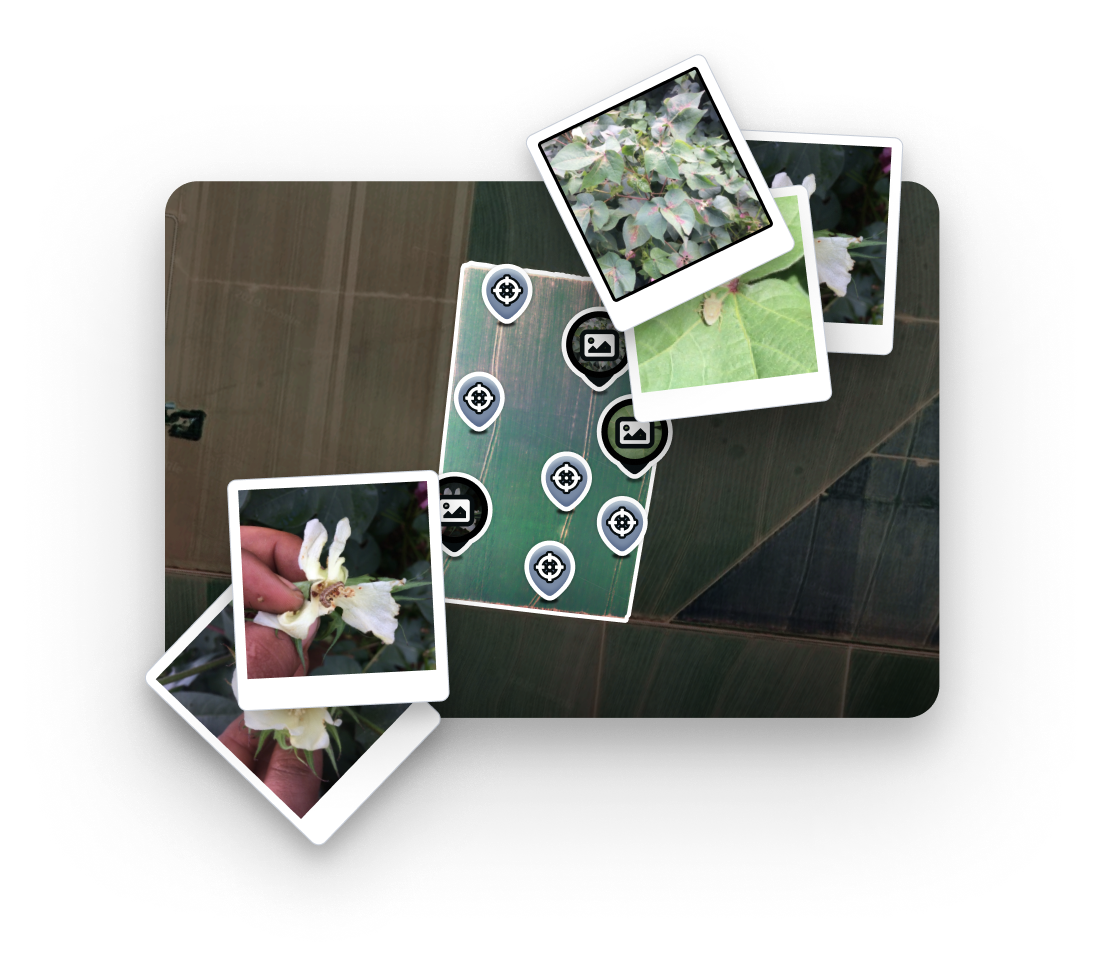
Every finding, every picture has a location. We've made it possible for you to see it.
Farmbox is built for sharing with you colleagues, your boss and your clients.
4% annual churn after the first year. In B2B SaaS, that's exceptional retention.
4+ million hectares monitored through Farmbox, about the size of Switzerland.
Yasmin Boemeke →
Ivan Neto →
Brauner Megda →
Josie Castanheira →
You can learn more about it on farmbox.com.br →

Farmbox grew fast. Our team needed a design system to stay consistent and ship without breaking things.
I built Soil, a responsive, accessible component library that cut design-to-dev handoff time by 80%.
Learn more about Soil →
Email: pdr.laguna@gmail.com →
Linkedin: Pedro Laguna da Rosa →
Twitter: @pdrlaguna →